
The Salesforce Utilization Heatmap: See Who Is Overbooked
Every room, person or asset down the side, every day across the top, and each cell showing how much of its capacity is booked. A capacity dashboard for your own Salesforce objects, set up without code.
"Is the team overbooked next week?" "Which room sits empty most of the month?" "Can we take on one more engagement?" Those are capacity questions. A calendar shows what is booked; it does not show how full anything is. A utilization heatmap does.
MultiDatePick's Utilization view reads the same bookings as its calendar and timeline and turns them into a grid of fill levels: one row per resource, one cell per day, each cell saying how many of that resource's places are taken. It is one config field away from any placement, and it needs nothing more than a number on the resource for capacity.
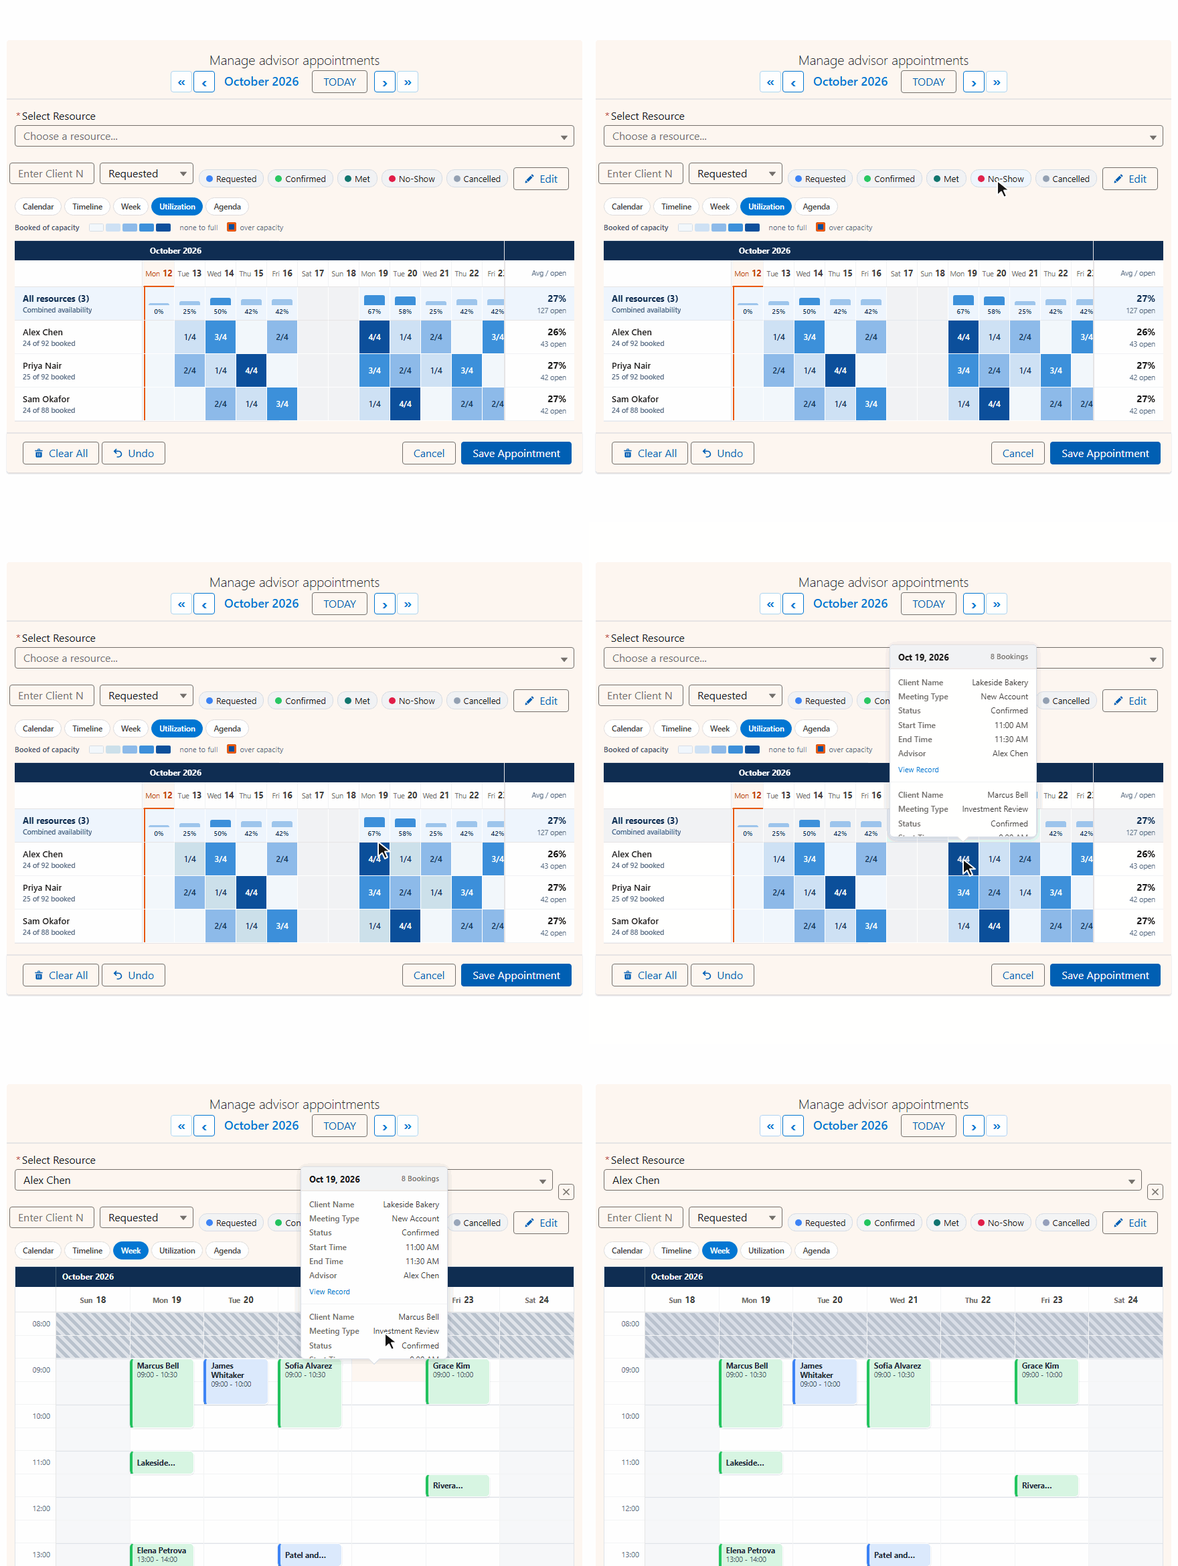
What the heatmap shows
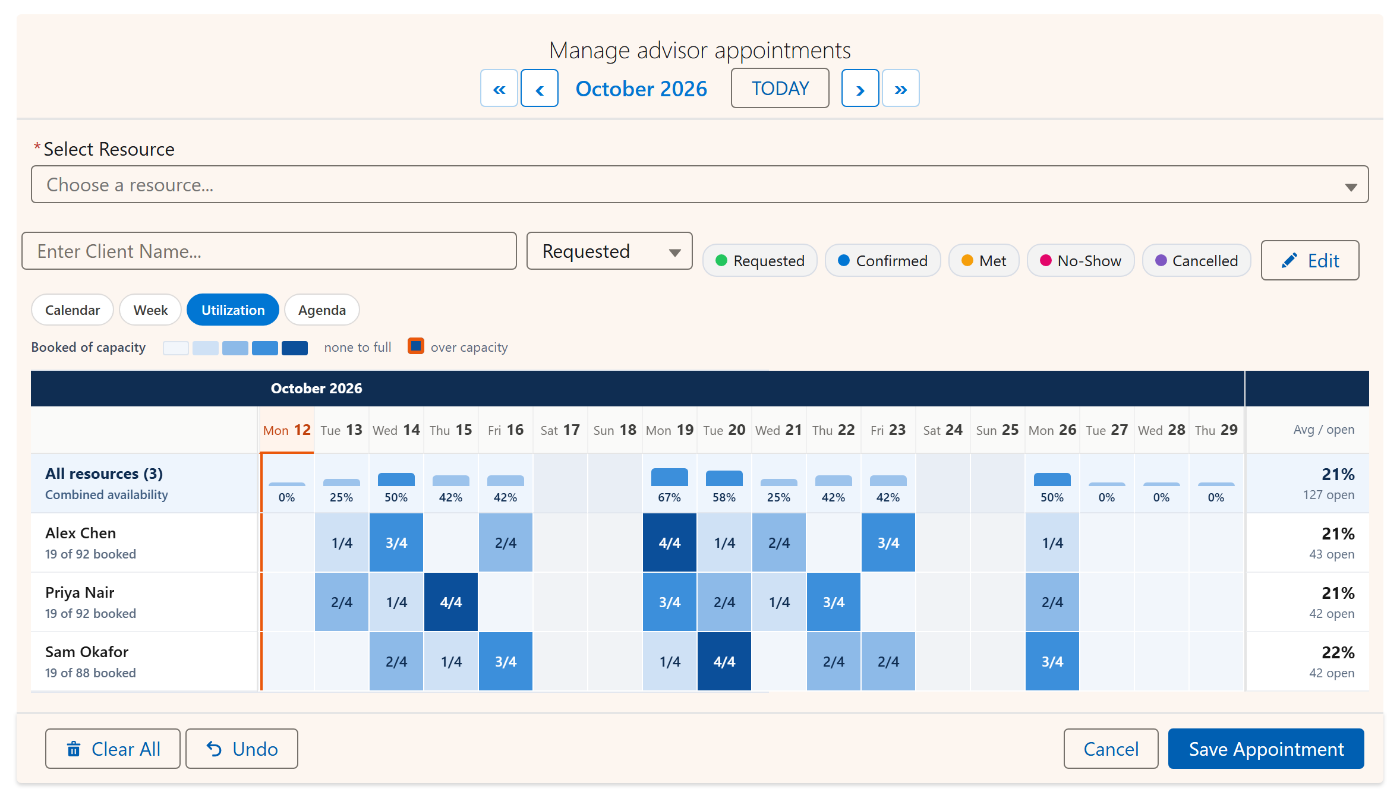
Booked of capacity
Each cell reads like 3/4: three of four places taken. The fuller the day, the darker the blue.
Overbooking flagged
A day booked past capacity gets an orange ring. It is never quietly capped at "full".
Combined availability
A row across the top shows the whole group's fill per day as a percentage, so the crunch days stand out.
Average and open
The right-hand column gives each resource's average for the month and how many places are still open from today.
Click to drill in
Click a booked cell and the component opens that resource's week on that day, ready to book or edit.
Works without capacity
No capacity field yet? Cells show a plain count of bookings on the same scale, and the grid says so.
A month of capacity in one look
Reports can tell you utilization, one question at a time. The heatmap shows the whole month at once, so patterns jump out that a report would never surface: the advisor who is full every Tuesday, the room nobody books on Fridays, the week where everyone is at capacity at the same time. The grid opens on today, keeps resource names pinned while you scroll, and counts open places only from today forward, because unused capacity last week cannot be booked anymore.
Multi-day work counts on every day it runs
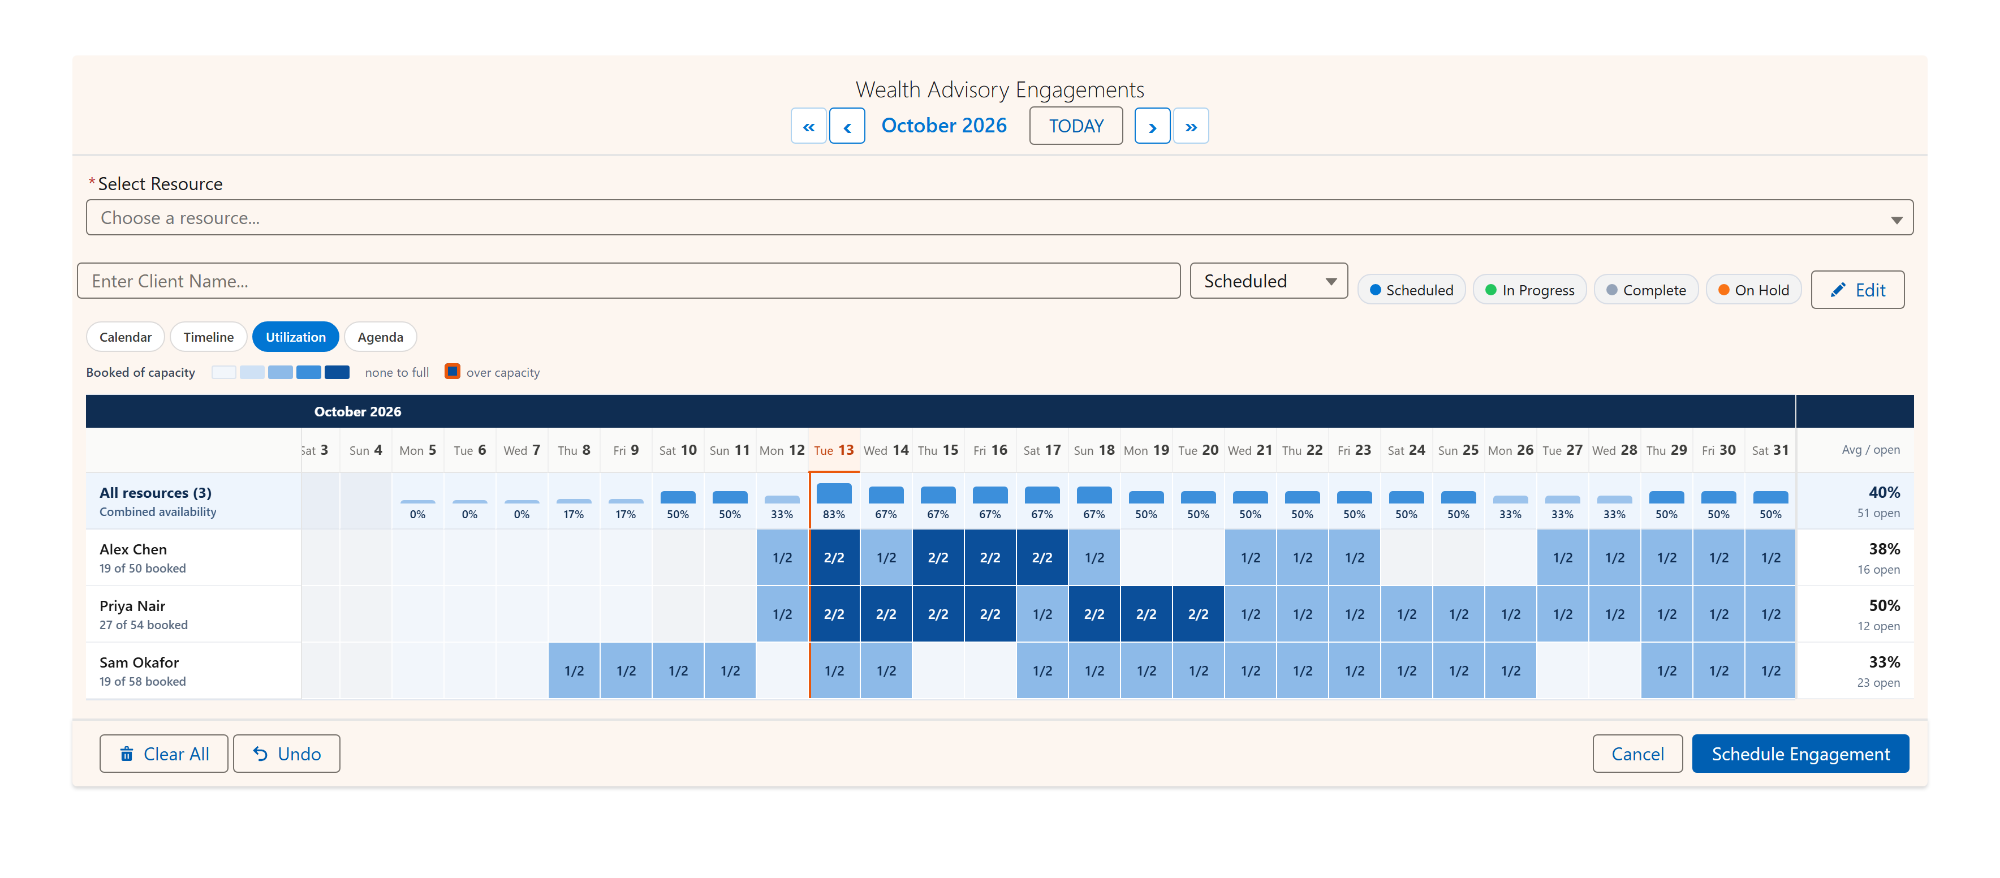
Capacity is not only about meetings. A consultant can carry two client engagements at a time; a crew can work one job site at once; a training room hosts one course for a whole week. The heatmap counts a multi-day booking on every day it covers, so an engagement that runs Monday to Friday fills five cells, not one. Set the capacity to the number of things a resource can carry at once and the grid shows exactly when each person is fully committed.
Who uses a Salesforce utilization heatmap
The resource can be any object, so the same view answers capacity questions for very different teams:
The settings that shape it
Every one of these is a property on the component and a field in the Setup Wizard, so nothing here needs code:
| Property | What it does |
|---|---|
| view | Set to utilization to open on it, or list it in availableViews to offer it in the switcher. |
| capacityField | A number field on the resource: how many bookings it can hold at once. Cells read booked against it. Leave it blank and cells show counts. |
| maxViewResources | Draw only this many rows, busiest first. Every resource still counts in the combined row. |
| resourceViewFilter | Show every resource, or only the ones with bookings in the month. |
| statusField | With status colors on, the status pills above the grid filter what is counted. Switch Cancelled off and those bookings drop out of every cell. |
Questions people ask
How do I see resource utilization in Salesforce?
Standard Salesforce has no utilization view for your own booking objects; you would build a report per question. MultiDatePick adds a Utilization view to the calendar component: each resource is a row, each day a cell showing booked against that resource's capacity, with a combined row for the whole group and an average and open count on the right.
What does a cell like 2/2 or 3/4 mean?
Bookings on that day against the resource's capacity. 3/4 means three of four places are taken. The darker the blue, the fuller the day, and a day booked past capacity gets an orange ring so it stands out.
What if my resource object has no capacity field?
The heatmap still works. Cells show a plain count of bookings on the same blue scale, and a note under the grid says so. Add a number field for capacity whenever you want percentages and open places instead.
Can I book or edit from the Utilization view?
Utilization is read only by design: it answers how full things are. Click any booked cell and the component opens that resource's week on that day, where you can book, move or edit.
Can the rows be people instead of rooms?
Yes. The resource can be any object, including User. Add a capacity number to User and the heatmap becomes a team capacity dashboard: who is full, who has room, and which weeks are overloaded.
Capacity you can see, on the objects you already have.
Start from the Team Capacity Planning config in the library, or try the live demo.
Browse the Config Library Try the Live DemoComing to AppExchange in 2026. One plan, every feature included.